BTC and ETH Options Risk Map: BTC and ETH (2026-10-05)
Daily BTC and ETH options market structure update covering spot context, support and resistance zones, liquidity walls, macro conditions, risk points and response measures.
Executive view: the current stance is long bias, with 84% confidence. BTC is +2.1% over the week and trades between $74,956 support and $87,399 resistance; ETH is +1.5% with $2,358 / $2,808. Macro pressure is 41/100, while option tail-risk scores are BTC 39/100 and ETH 35/100. The directional view remains conditional on spot acceptance, volume, fresh open interest and executable quotes confirming the level.
The current setup is a risk-map problem rather than a simple direction call. The important levels are where spot meets clustered options liquidity and whether volatility is priced above or below recent realized movement.
- Published
- October 5, 2026
- Updated
- October 5, 2026
- Author
- richard_hardwell
- Topic Hub
- Crypto Options
- Reading time
- 15 min read
- Report type
- Daily Market Structure Brief
- Market stance
- long (84%)
Executive view: the current stance is long bias, with 84% confidence. BTC is +2.1% over the week and trades between $74,956 support and $87,399 resistance; ETH is +1.5% with $2,358 / $2,808. Macro pressure is 41/100, while option tail-risk scores are BTC 39/100 and ETH 35/100. The directional view remains conditional on spot acceptance, volume, fresh open interest and executable quotes confirming the level.
The current setup is a risk-map problem rather than a simple direction call. The important levels are where spot meets clustered options liquidity and whether volatility is priced above or below recent realized movement.
BTC is trading near $86,798 with support around $74,956 and resistance around $87,399. ETH is trading near $2,739 with support around $2,358 and resistance around $2,808. The risk score is 39/100 for BTC and 35/100 for ETH; the quality of any position response therefore depends on level confirmation and executable quotes.
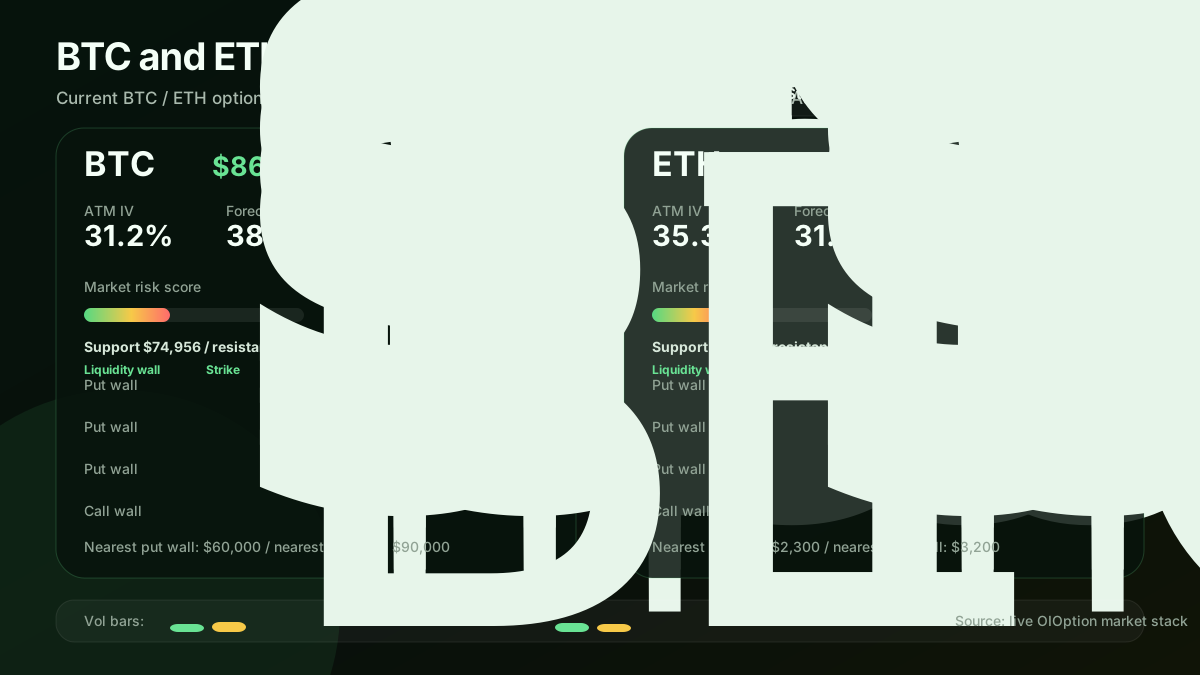
Current IV/RV spread, tail-risk pressure, major put/call OI walls and tradeable hedge zones.
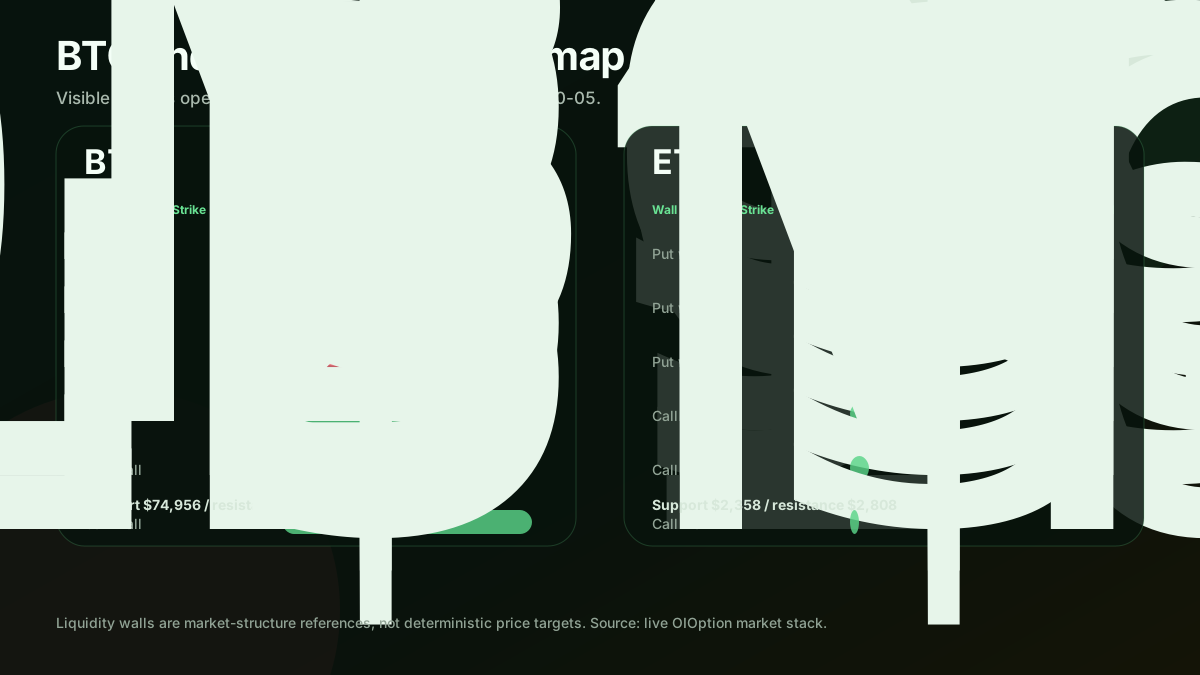
Standalone view of visible BTC and ETH put/call open-interest walls around spot.

Public view of market-risk pressure and the liquidity conditions surrounding BTC and ETH options.
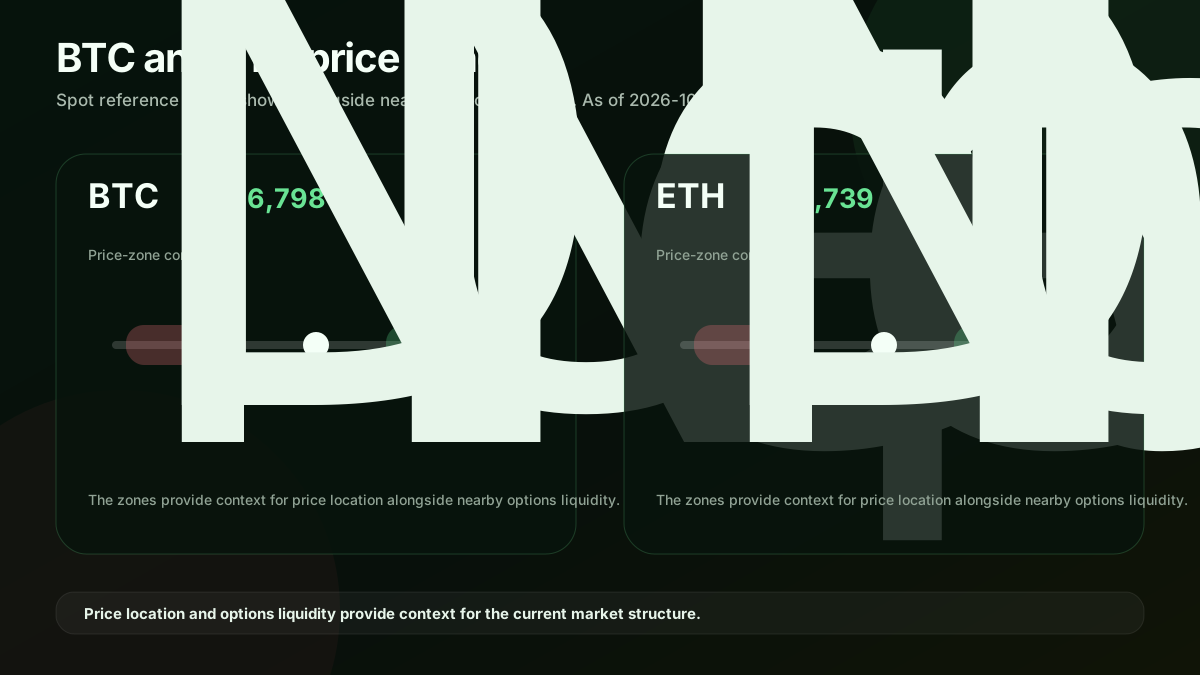
Spot reference zones shown alongside nearby put and call open-interest concentrations.
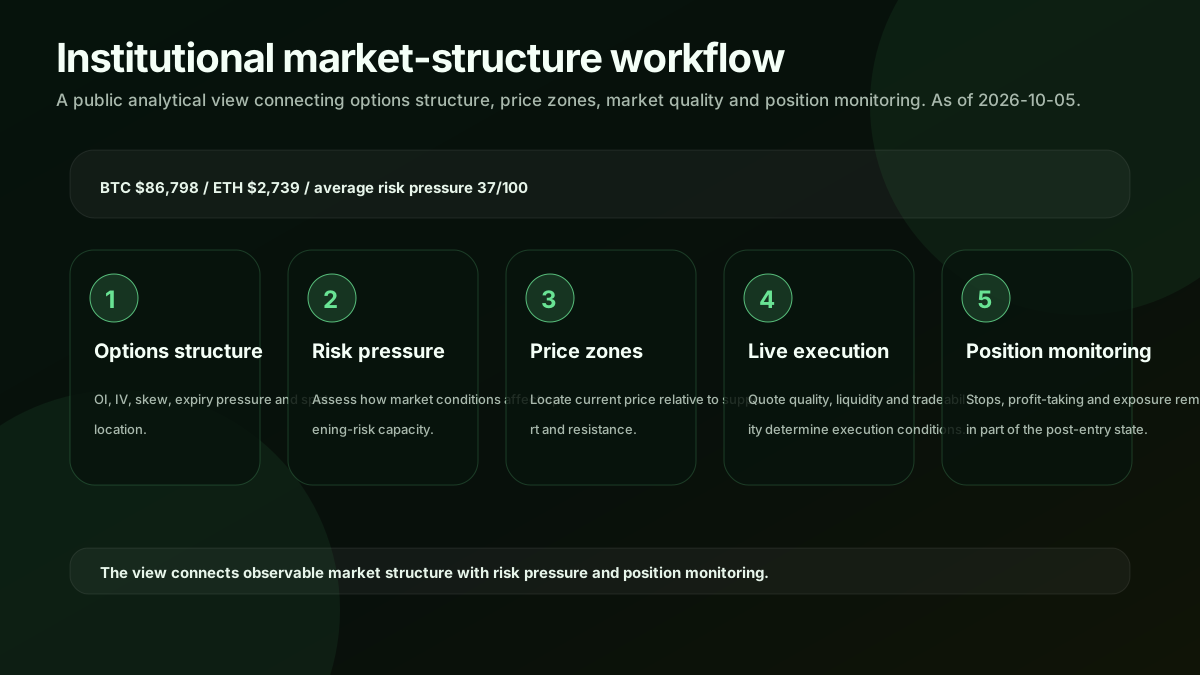
A public analytical view connecting options structure, price zones, market quality and position monitoring.
BTC market structure
BTC is trading around $86,798. The current structure is mixed, with options positioning and spot confirmation still not fully aligned. The commonly watched support zone sits near $74,956, while resistance is near $87,399. Visible options liquidity places the nearest put wall around $60,000 and the nearest call wall around $90,000.
ATM IV is 31.2% versus forecast realized volatility at 38.0%, leaving an IV-RV spread of -6.8%. The market-risk score is 39/100, and front-expiry concentration is 1.1%.
- -Liquidity wall focus: $60,000 on the downside and $90,000 on the upside.
- -Put-call OI ratio: 0.56.
- -Options reference row: 2026-10-07 BTC put around $84,000 with estimated premium 0.22% of spot.
ETH market structure
ETH is trading around $2,739. The current structure is range-bound, with support and resistance levels carrying more information than momentum. The commonly watched support zone sits near $2,358, while resistance is near $2,808. Visible options liquidity places the nearest put wall around $2,300 and the nearest call wall around $3,200.
ATM IV is 35.3% versus forecast realized volatility at 31.6%, leaving an IV-RV spread of +3.7%. The market-risk score is 35/100, and front-expiry concentration is 6.4%.
- -Liquidity wall focus: $2,300 on the downside and $3,200 on the upside.
- -Put-call OI ratio: 0.58.
- -Options reference row: 2026-10-07 ETH put around $2,600 with estimated premium 0.20% of spot.
Macro environment
Current macro-volatility read is supportive with a 41/100 pressure score. Deribit volatility proxies show BTC DVOL at 36.5% and ETH DVOL at 49.7%; perpetual 24h impulse is BTC +1.8% and ETH +1.4%.
The desk view is constructive but not careless: macro is not blocking risk, while execution discipline remains important around crowded levels and premium cost.
- -Volatility proxy: BTC DVOL 36.5% (+1.0 pts 24h), ETH DVOL 49.7% (+1.3 pts 24h).
- -Perpetual impulse: BTC +1.8% 24h, ETH +1.4% 24h; funding is BTC +0.000%, ETH +0.000%.
- -Macro is used as an execution-quality filter; it adjusts entry discipline and hedge urgency, not the core strategy signal.
External macro, policy and capital-flow context
The following public signals are included as context inputs rather than standalone trade signals. The options view is interpreted alongside spot acceptance, OI, volume, IV behavior and executable spread quality.
- -Capital / CryptoSlate: Bitcoin’s $85,000 recovery awaits proof that ETF investors kept buying after payrolls - CryptoSlate (2026-10-04).
- -Macro / CryptoQuant: Bitcoin’s Bear Market Ended This Summer — A New Buyer Base Is Emerging | CryptoQ... - CryptoQuant (2026-10-04).
- -Macro / TradingKey: Bitcoin (BTCUSD) Is up 1.01% on Oct 4: What Do On-Chain Data and Market Sentiment Show? - TradingKey (2026-10-04).
- -Policy / Yahoo Finance Singapore: Bitcoin holds near $85,000 as SEC clears first 3x leveraged crypto ETPs - Yahoo Finance Singapore (2026-10-04).
- -Macro / ForkLog: Week in review: Bitcoin posts best Q3 since 2017; MetaMask pulls validators after staking incident - ForkLog (2026-10-04).
- -Capital / Binance: bitcoinspotetfsdraw$6.34binflowsinq3 - Binance (2026-10-04).
- -Macro / StoneX: Q4 2026 Bitcoin Outlook: Did the August Rally Mark the Cycle Low? - StoneX (2026-10-04).
- -Capital / Decrypt News: 'Uptober' Starts Green as Bitcoin ETFs Draw $134 Million - Decrypt News (2026-10-04).
Objective market view and options scenarios
The current setup is best treated as a range-management tape, not a standalone directional call. Average 24h spot change is +1.7%, average options risk score is 37/100, and macro-volatility context is supportive with a 41/100 pressure score. BTC is near $86,798 with support / resistance at $74,956 / $87,399; ETH is near $2,739 with support / resistance at $2,358 / $2,808.
The analysis sets out the conditions under which hedge, upside or premium-exposure decisions would change.
- -In a selloff, the first confirmation variable is spot acceptance below support accompanied by volume and quote deterioration. The information content increases if put-side OI expands around BTC put wall near $60,000 with OI $546,330,964 and ETH put wall near $2,300 with OI $51,767,663, ATM IV rises faster than realized movement, and protection remains executable without stale or wide rows. Liquid protection rows such as 2026-10-07 BTC put around $84,000, premium 0.22% of spot, liquidity score 98/100 provide the clearest downside reference.
- -In a rally, the first confirmation variable is spot acceptance above resistance rather than a single wick through the level. The upside case strengthens if call-side positioning absorbs BTC call wall near $90,000 with OI $623,999,424 and ETH call wall near $3,200 with OI $190,175,742, new call OI appears with 24h volume confirmation, and IV remains orderly. Risk-defined call exposure or a call spread then provides a more transparent upside expression.
- -In a range, the useful variable is not direction but premium discipline. Repeated rejection at support and resistance, compression in ATM IV, and OI remaining near visible walls describe a range-management regime. In that setting, liquid strikes and measured execution carry more information than headline levels or urgent market orders.
- -The view is invalidated by a level touch without volume, a volatility move without executable depth, or an options row with stale quotes; none of these observations alone confirms a new regime.
Risk points and response
The main risk is not a single direction call. It is the combination of spot moving through a liquidity wall, spreads widening, and hedges becoming expensive after the market has already moved.
The response remains conditional: the support-resistance map, quote quality and persistence after a level touch carry more weight than the touch itself.
- -A break below the nearest put wall would shift the market from range management into forced-risk reduction.
- -A move into call-wall resistance without volume confirmation would leave the tape vulnerable to failed breakout behavior.
- -If bid/ask spreads widen while IV rises, execution quality becomes the main risk rather than direction alone.
- -Forecast realized volatility is above implied volatility in part of the stack, which can reprice quickly if spot starts moving.
- -Near illiquid strikes, smaller size and limit-order execution generally produce more controlled outcomes than crossing a wide market.
- -Support is considered invalidated only after spot trades below it with volume and quote deterioration.
- -Resistance is considered confirmed only if spot holds above the call-wall zone without a disorderly volatility spike.
- -For large spot books, protection centered on liquid strikes is generally more robust than selecting the lowest-premium rows.
Signal quality, multi-horizon confirmation and execution map
BTC At the current price location, The first filter is location: a level matters only when spot, traded volume and option inventory meet in the same area. Daily, weekly and monthly readings are aligned only when the short-term move is supported by the higher-timeframe trend; a single candle cannot replace that test. Open interest is treated as inventory, not intent. Without turnover, fresh quotes and price acceptance, a large strike remains a map reference rather than a signal. The useful volatility question is whether implied volatility is repricing faster than realized movement and whether that premium can still be executed at a controlled spread. Spot $86,798; the one-day, one-week and one-month changes are +1.8% / +2.1% / +8.3%.
BTC Across the daily, weekly and monthly horizons, A headline becomes information only after it changes spot acceptance, volume, open interest or the quality of executable quotes. Macro sets the risk budget and urgency of protection; it does not override the observed BTC and ETH structure. Support and resistance are working zones, not exact predictions. The immediate map gives priority to levels close enough to current spot to remain decision-relevant. SMA20/SMA50 are $82,874 / $79,043; ATM IV is 31.2%, with 1.1% of visible open interest in the front expiry.
BTC For signal quality, the relevant question is A clean confirmation requires persistence after the first touch, participation through volume and a quote surface that remains tradeable. A reversible risk posture preserves optionality when evidence is mixed and allows the market to disprove the initial reading without forcing a binary conclusion. Noise often appears persuasive when stale or correlated observations repeat one narrative; independent evidence separates a durable signal from a convenient story. Nearby put and call walls are $60,000 / $90,000; the tail-risk score is 39/100.
BTC sits in a market where price location and the shape of the options surface describe different parts of the same state. The spot change gives the immediate direction, while the weekly and monthly readings establish whether that direction belongs to a broader trend. A move that travels toward $74,956 or $87,399 therefore carries more information when participation and inventory change with it, rather than when price alone prints a new extreme.
The moving-average relationship provides a slower reference for BTC. SMA20 at $82,874 and SMA50 at $79,043 describe the recent path and the longer memory of the tape, but neither level is a forecast. When price, the two averages and the nearby option walls point in the same direction, the market is easier to classify; when they diverge, the divergence is itself a material part of the daily result.
The option inventory around BTC is useful because it shows where exposure is concentrated, not because it reveals the intention of every participant. Put and call walls at $60,000 and $90,000 can influence hedging and rolling when price approaches them. Their significance rises with fresh turnover and stable quotes, and falls when the chain is old or the concentration is isolated from the underlying price response.
ATM IV of 31.2% and front-expiry concentration of 1.1% describe the cost and timing of the market's risk transfer. A high implied-volatility reading can represent demand for protection, event uncertainty or a repricing of premium. The distinction comes from its relationship with realized movement, spot participation and the quality of the available quote surface, rather than from the level in isolation.
The daily, weekly and monthly changes for BTC are +1.8%, +2.1% and +8.3%. Reading them together avoids assigning too much meaning to a single session. A positive daily move inside a weak weekly structure has a different implication from a positive daily move that extends an established weekly and monthly trend; the same distinction applies to a downside move.
A market headline becomes analytically relevant when it leaves a measurable trace in BTC: a change in spot acceptance, turnover, open interest, implied volatility or quoted depth. Without that trace, the headline remains context. This separation is especially important in options, where a vivid narrative can coexist with unchanged inventory and no durable change in price behavior.
The quality of the signal depends on agreement among independent observations. Price persistence, participation through volume, changes in open interest and a tradeable quote surface each describe a different part of the state. Repetition of the same stale observation does not add the same information as a new observation that confirms the underlying through another channel.
Macro conditions enter the BTC analysis through liquidity, rates, the dollar and broad risk appetite. They can alter the speed of a move and the price of protection without erasing the market structure visible in the spot and options data. The useful distinction is between a macro impulse that changes the tape and a macro narrative that has not yet reached it.
The current map remains probabilistic. Support near $74,956 and resistance near $87,399 are reference zones formed from recent price behavior, while the put and call walls show where options inventory is visible. A zone becomes more informative when price spends time around it and the surrounding data remain coherent; a brief intraday touch has lower evidentiary value.
For BTC, the invalidation case is as important as the preferred reading. A move that loses support with participation, a volatility repricing without usable depth, or a material change in inventory can weaken the original interpretation. The result is not a command to act; it is a change in the probability map that belongs in the written conclusion.
ETH At the current price location, The first filter is location: a level matters only when spot, traded volume and option inventory meet in the same area. Daily, weekly and monthly readings are aligned only when the short-term move is supported by the higher-timeframe trend; a single candle cannot replace that test. Open interest is treated as inventory, not intent. Without turnover, fresh quotes and price acceptance, a large strike remains a map reference rather than a signal. The useful volatility question is whether implied volatility is repricing faster than realized movement and whether that premium can still be executed at a controlled spread. Spot $2,739; the one-day, one-week and one-month changes are +1.5% / +1.5% / +11.1%.
ETH Across the daily, weekly and monthly horizons, A headline becomes information only after it changes spot acceptance, volume, open interest or the quality of executable quotes. Macro sets the risk budget and urgency of protection; it does not override the observed BTC and ETH structure. Support and resistance are working zones, not exact predictions. The immediate map gives priority to levels close enough to current spot to remain decision-relevant. SMA20/SMA50 are $2,649 / $2,502; ATM IV is 35.3%, with 6.4% of visible open interest in the front expiry.
ETH For signal quality, the relevant question is A clean confirmation requires persistence after the first touch, participation through volume and a quote surface that remains tradeable. A reversible risk posture preserves optionality when evidence is mixed and allows the market to disprove the initial reading without forcing a binary conclusion. Noise often appears persuasive when stale or correlated observations repeat one narrative; independent evidence separates a durable signal from a convenient story. Nearby put and call walls are $2,300 / $3,200; the tail-risk score is 35/100.
ETH sits in a market where price location and the shape of the options surface describe different parts of the same state. The spot change gives the immediate direction, while the weekly and monthly readings establish whether that direction belongs to a broader trend. A move that travels toward $2,358 or $2,808 therefore carries more information when participation and inventory change with it, rather than when price alone prints a new extreme.
The moving-average relationship provides a slower reference for ETH. SMA20 at $2,649 and SMA50 at $2,502 describe the recent path and the longer memory of the tape, but neither level is a forecast. When price, the two averages and the nearby option walls point in the same direction, the market is easier to classify; when they diverge, the divergence is itself a material part of the daily result.
The option inventory around ETH is useful because it shows where exposure is concentrated, not because it reveals the intention of every participant. Put and call walls at $2,300 and $3,200 can influence hedging and rolling when price approaches them. Their significance rises with fresh turnover and stable quotes, and falls when the chain is old or the concentration is isolated from the underlying price response.
ATM IV of 35.3% and front-expiry concentration of 6.4% describe the cost and timing of the market's risk transfer. A high implied-volatility reading can represent demand for protection, event uncertainty or a repricing of premium. The distinction comes from its relationship with realized movement, spot participation and the quality of the available quote surface, rather than from the level in isolation.
The daily, weekly and monthly changes for ETH are +1.5%, +1.5% and +11.1%. Reading them together avoids assigning too much meaning to a single session. A positive daily move inside a weak weekly structure has a different implication from a positive daily move that extends an established weekly and monthly trend; the same distinction applies to a downside move.
A market headline becomes analytically relevant when it leaves a measurable trace in ETH: a change in spot acceptance, turnover, open interest, implied volatility or quoted depth. Without that trace, the headline remains context. This separation is especially important in options, where a vivid narrative can coexist with unchanged inventory and no durable change in price behavior.
The quality of the signal depends on agreement among independent observations. Price persistence, participation through volume, changes in open interest and a tradeable quote surface each describe a different part of the state. Repetition of the same stale observation does not add the same information as a new observation that confirms the underlying through another channel.
Macro conditions enter the ETH analysis through liquidity, rates, the dollar and broad risk appetite. They can alter the speed of a move and the price of protection without erasing the market structure visible in the spot and options data. The useful distinction is between a macro impulse that changes the tape and a macro narrative that has not yet reached it.
The current map remains probabilistic. Support near $2,358 and resistance near $2,808 are reference zones formed from recent price behavior, while the put and call walls show where options inventory is visible. A zone becomes more informative when price spends time around it and the surrounding data remain coherent; a brief intraday touch has lower evidentiary value.
For ETH, the invalidation case is as important as the preferred reading. A move that loses support with participation, a volatility repricing without usable depth, or a material change in inventory can weaken the original interpretation. The result is not a command to act; it is a change in the probability map that belongs in the written conclusion.
Action points
- -BTC support/resistance: $74,956 / $87,399; ETH support/resistance: $2,358 / $2,808.
- -Liquidity quality is the first execution constraint: wide spreads and stale option rows reduce the reliability of additional size.
- -If spot breaks a liquidity wall with volume and IV expansion, discretionary exposure becomes less attractive and protection closer to the active zone becomes more relevant.
Disclosure
This research note is for market-structure analysis and product education. It is not investment advice, a solicitation, or a guarantee of execution quality.
Option quotes and liquidity walls can change quickly. Live bid/ask depth, account margin rules, fees and settlement mechanics remain outside this research note and affect any trading decision.