US Equity Daily: Index leadership is split and conviction is limited (2026-10-08)
An evidence-led assessment of US equity direction, participation, volatility and option inventory across major index proxies and the most active verified names.
Our base case is neutral, with 73% confidence. QQQ, SPY and DIA show an average one-day move of -0.39%, a five-session move of +1.61%, and a one-month move of +1.75%. The tape is in a quiet regime, with average 20-day realized volatility of 11.9%.
The conclusion comes from breadth, not from the strongest single ticker: 2 of 3 available benchmark proxies are positive over one month and 1 are negative. The disagreement argues for a neutral aggregate view until participation broadens or weakness becomes common across indices.
- Published
- October 8, 2026
- Updated
- October 8, 2026
- Author
- heidegger_softstrong
- Topic Hub
- US Equity Options
- Reading time
- 8 min read
- Report type
- US Equity Daily Strategy Note
- Market stance
- neutral (73%)
Our base case is neutral, with 73% confidence. QQQ, SPY and DIA show an average one-day move of -0.39%, a five-session move of +1.61%, and a one-month move of +1.75%. The tape is in a quiet regime, with average 20-day realized volatility of 11.9%.
The conclusion comes from breadth, not from the strongest single ticker: 2 of 3 available benchmark proxies are positive over one month and 1 are negative. The disagreement argues for a neutral aggregate view until participation broadens or weakness becomes common across indices.
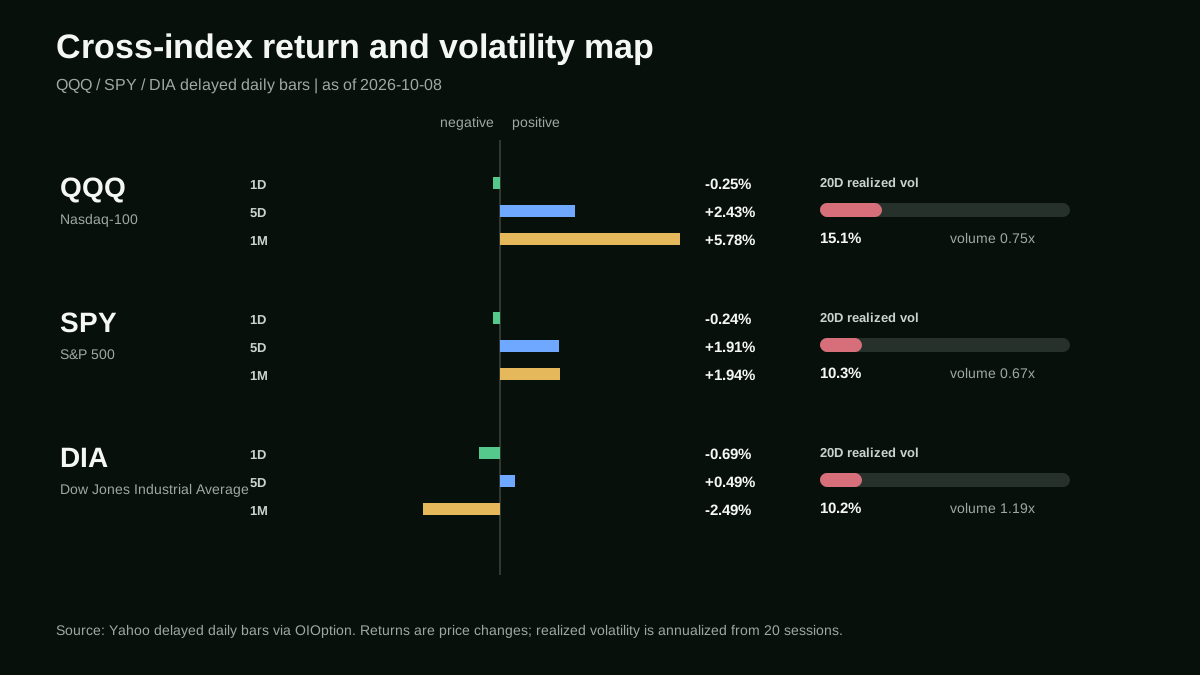
QQQ, SPY and DIA returns across three horizons with 20-day realized volatility and participation.
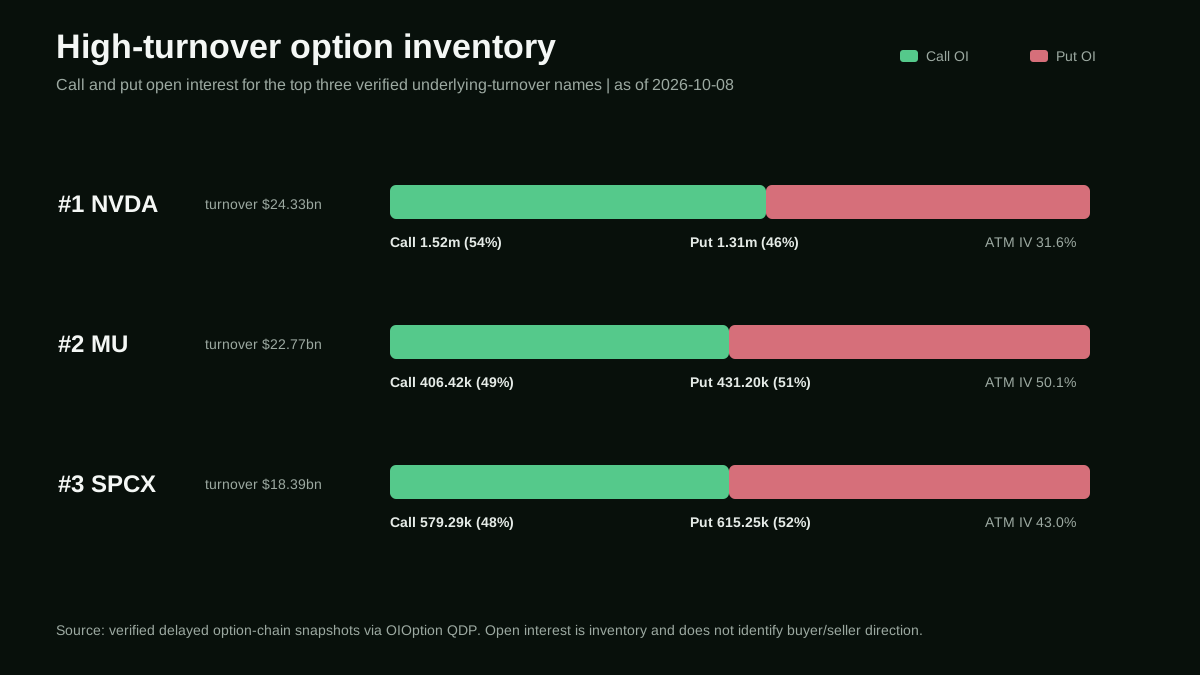
Call/put open-interest composition for the three highest-turnover verified option underlyings.
Investment view
Evidence is ranked deliberately: cross-index price breadth determines direction; realized volatility and volume determine the quality of that direction; option inventory measures where participation is concentrated; news supplies testable context. A lower-ranked input cannot overrule a contradictory higher-ranked signal.
Data cutoff: benchmark bars are observed through 2026-10-07T13:30:00Z; option inventory is observed through 2026-10-07T20:15:02.066849401Z. Both are delayed reference snapshots, and the publication date must not be read as a live quote timestamp.
The evidence behind the view
We treat QQQ, SPY and DIA as liquid proxies for growth, the broad large-cap market and industrial/value exposure. Agreement among them is stronger evidence than a move concentrated in one index.
QQQ (Nasdaq-100) closed at $757.73: -0.25% over one day, +2.43% over five sessions and +5.78% over one month. Realized volatility is 15.1%; latest volume is 0.75x of its 20-day average. The weekly and monthly horizons confirm each other, so the trend evidence is positive rather than merely intraday.
SPY (S&P 500) closed at $777.22: -0.24% over one day, +1.91% over five sessions and +1.94% over one month. Realized volatility is 10.3%; latest volume is 0.67x of its 20-day average. The weekly and monthly horizons confirm each other, so the trend evidence is positive rather than merely intraday.
DIA (Dow Jones Industrial Average) closed at $511.02: -0.69% over one day, +0.49% over five sessions and -2.49% over one month. Realized volatility is 10.2%; latest volume is 1.19x of its 20-day average. The horizons disagree, so this proxy is a source of dispersion rather than confirmation.
Options activity: participation, not a directional vote
The three highest-turnover verified option underlyings are NVDA, MU, SPCX. Their combined chain contains 4244 contracts, 4.16m contracts of reported session volume and 4.85m contracts of open interest. Aggregate inventory is two-sided, but open interest cannot reveal whether options were bought or sold; it measures where exposure exists, not the sign of the trade.
#1 NVDA: underlying turnover $24.33bn; spot $237.47; one-day / five-session / one-month returns -0.74% / +3.98% / +6.17%. The verified chain contains 896 rows with call/put open interest of 1.52m / 1.31m (53.7% calls) and ATM IV of 31.6%. The snapshot is 2.2h old. Price is above both the 20- and 50-day averages, so option activity is occurring inside a positive trend structure.
#2 MU: underlying turnover $22.77bn; spot $1,088.00; one-day / five-session / one-month returns +4.06% / +2.15% / +5.86%. The verified chain contains 2592 rows with call/put open interest of 406.42k / 431.20k (48.5% calls) and ATM IV of 50.1%. The snapshot is 2.2h old. Price is above both the 20- and 50-day averages, so option activity is occurring inside a positive trend structure.
#3 SPCX: underlying turnover $18.39bn; spot $167.60; one-day / five-session / one-month returns -2.51% / +11.10% / +13.59%. The verified chain contains 756 rows with call/put open interest of 579.29k / 615.25k (48.5% calls) and ATM IV of 43.0%. The snapshot is 2.2h old. Price is above both the 20- and 50-day averages, so option activity is occurring inside a positive trend structure.
Event and news context
News is used as context, not as a retroactive explanation for every price move. The following recent items can affect discount rates, index earnings expectations or active names in this report; causality still requires confirmation in price, breadth and volatility.
- -Federal Reserve (2026-10-07): Minutes of the Federal Open Market Committee, September 15-16, 2026 Relevance: policy and rates can reprice the equity discount rate across all three benchmarks.
- -SEC (2026-10-06): SEC Seeks Final Judgment Against Former Western Asset Co-CIO Ken Leech in Cherry Picking Case Relevance: policy and rates can reprice the equity discount rate across all three benchmarks.
- -SEC (2026-10-06): SEC to Host Virtual National Compliance Outreach Seminar for Investment Companies and Investment Advisers Relevance: policy and rates can reprice the equity discount rate across all three benchmarks.
- -Federal Reserve (2026-10-05): Federal Reserve Board announces approval of application by Isabella Bank Corporation Relevance: policy and rates can reprice the equity discount rate across all three benchmarks.
Scenario map and conclusion
Base case: retain the neutral assessment until at least two benchmark proxies establish a common five-session direction inconsistent with the aggregate view. The present reading is a market-state assessment, not a price target.
Upside confirmation requires at least two of QQQ, SPY and DIA to remain positive over five sessions while volume participation moves toward or above the 20-day norm. That combination would show breadth and participation reinforcing price.
Downside confirmation requires at least two proxies to turn negative over five sessions alongside rising realized volatility. For the active names, breaks below the observed 20-session ranges (NVDA $208.93, MU $902.60, SPCX $142.87) would add company-level evidence, but would not alone define the index regime.
Conclusion: US equities lack a unified direction; preserving optionality is more defensible than forcing a bullish or bearish narrative. The options data supports the participation assessment, while the benchmark complex remains the authority for market direction. The view should change when the cross-index evidence changes, not when one headline or one option strike becomes conspicuous.
Desk conclusion
- -Direction: neutral, supported by 2/3 positive one-month benchmark proxies.
- -Participation: the top-turnover option group is two-sided, but inventory is not treated as a directional flow signal.
- -What changes the view: a common five-session reversal across at least two benchmark proxies, confirmed by volume and realized volatility.
Disclosure
All market and option-chain observations are delayed reference data and may differ from executable prices. This report is informational research, not investment advice or a solicitation.
ETF proxies do not represent every US stock, and option open interest can reflect hedges, spreads, overwriting or stale positions. Conclusions should be updated when source coverage, freshness or cross-index agreement changes.