Institutional Entry Intelligence

Crypto Liquidation Heatmap for Institutional Entry Bands

OIOption turns aggregated liquidation pressure into an entry-band workflow for desks that need cleaner opening prices, tighter execution discipline, and better capital deployment.

Entry Quality

Improves where risk is opened after a valid setup exists.

Aggregated Pressure

Converts market-wide stress into a product-level execution signal.

Execution Discipline

Separates opening-price quality from stop-loss and take-profit logic.

Data cadence

Market structure snapshot

Snapshot date: September 17, 2026

Daily BTC and ETH options market structure update covering spot context, support and resistance zones, liquidity walls, macro conditions, risk points and response measures.

  • -BTC support/resistance: $74,956 / $82,285; ETH support/resistance: $2,357 / $2,667.
  • -Liquidity quality is the first execution constraint: wide spreads and stale option rows reduce the reliability of additional size.
  • -If spot breaks a liquidity wall with volume and IV expansion, discretionary exposure becomes less attractive and protection closer to the active zone becomes more relevant.
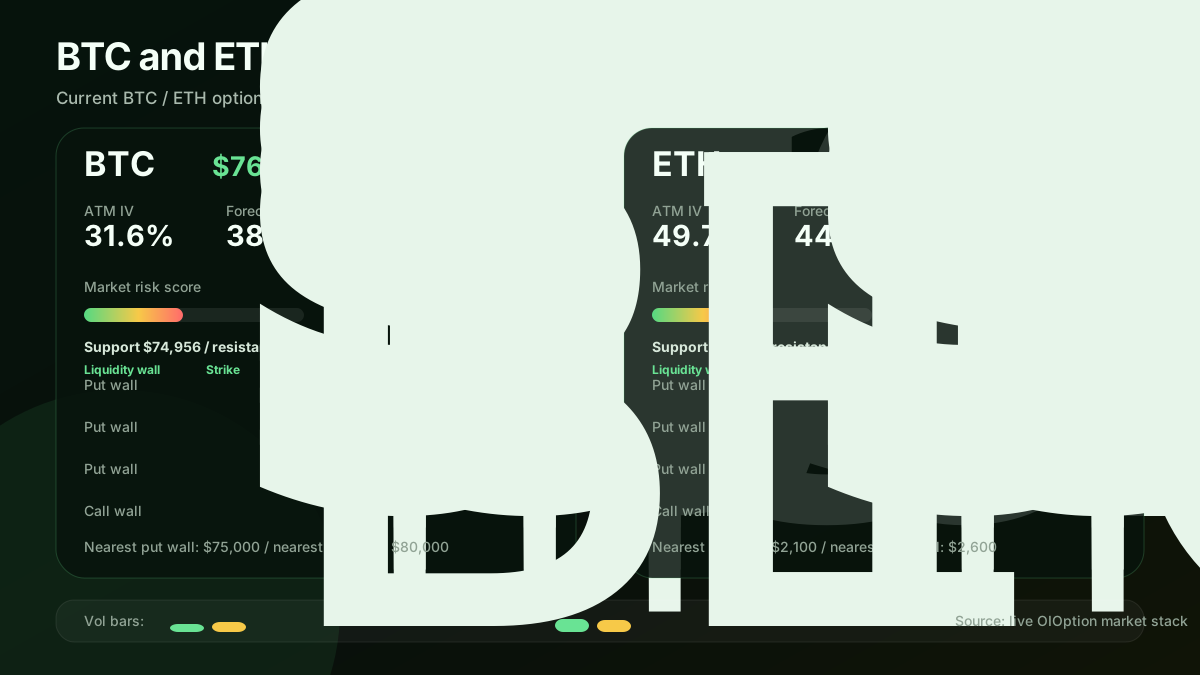
BTC and ETH Options Risk Map: BTC and ETH (2026-09-17)

Institutional execution logic

Protect entry quality before position management

The first principle for institutional execution is the price at which capital enters the market. After intent, permission, and structure align, entry location decides whether the position starts from strength or weakness.

Liquidation bands serve opening-price control. The risk gate serves entry permission. Take-profit, stop-loss, and position management remain separate control layers.

Market Structure Charts

Daily market structure view

Open full report
BTC and ETH options risk map (2026-09-17)
BTC and ETH options risk map

Current IV/RV spread, tail-risk pressure, major put/call OI walls and tradeable hedge zones.

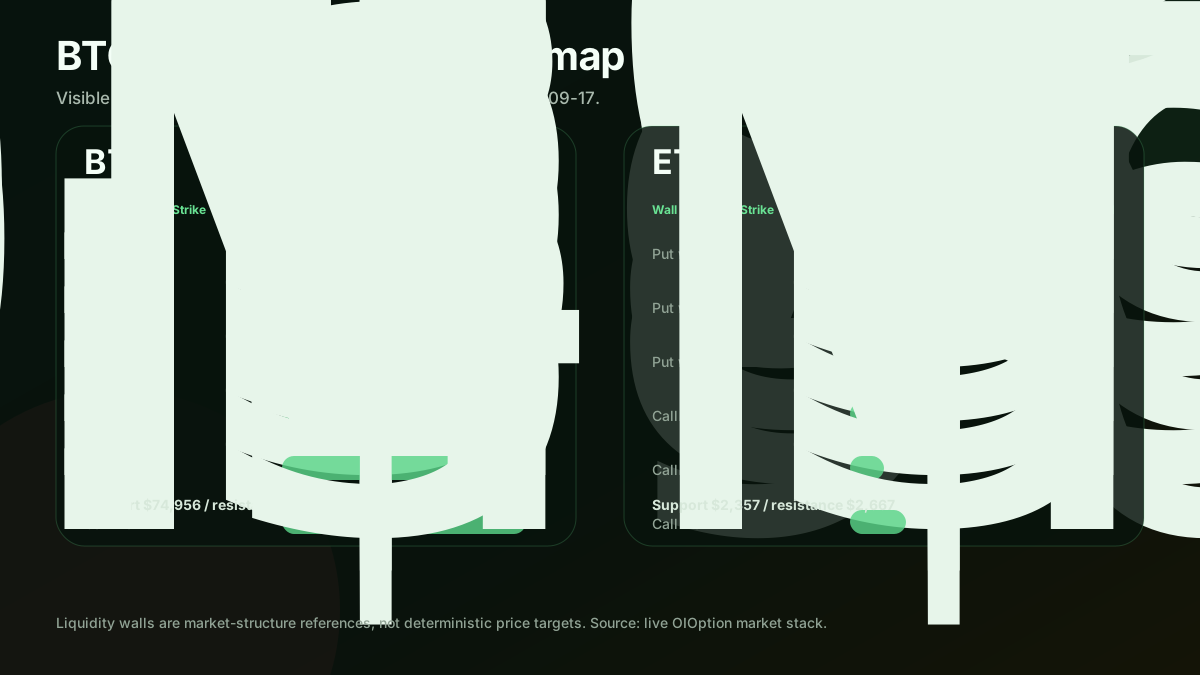
BTC and ETH options liquidity wall map as of 2026-09-17
BTC and ETH liquidity wall map

Standalone view of visible BTC and ETH put/call open-interest walls around spot.

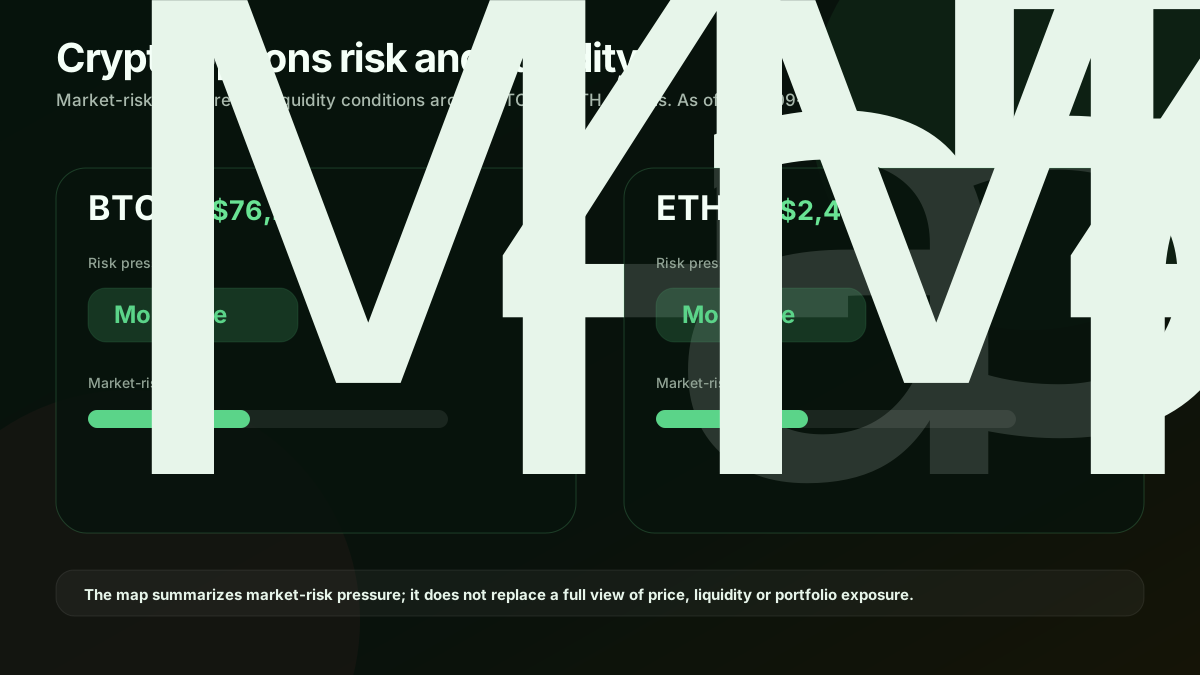
Crypto options risk and liquidity map for BTC and ETH as of 2026-09-17
Crypto options risk and liquidity map

Public view of market-risk pressure and the liquidity conditions surrounding BTC and ETH options.

BTC and ETH price zones and options liquidity as of 2026-09-17
BTC and ETH price zones

Spot reference zones shown alongside nearby put and call open-interest concentrations.

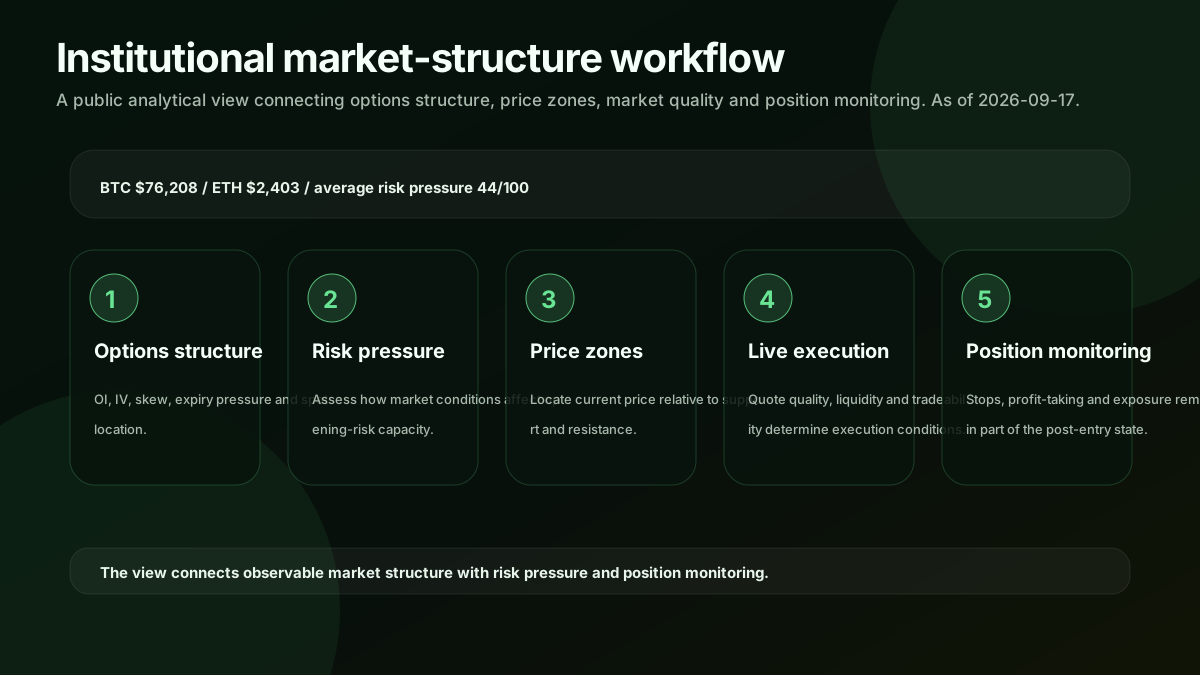
Institutional crypto options market-structure workflow as of 2026-09-17
Institutional market-structure workflow

A public analytical view connecting options structure, price zones, market quality and position monitoring.

01

The execution problem

Professional desks can lose edge even when the trade thesis is right. The common failure is opening risk into the wrong part of liquidity, where the market has already taxed urgency.

The liquidation heatmap addresses that opening-price problem. It gives the desk a cleaner entry band after direction, permission, and market structure are already aligned.

02

Where it fits in the workflow

Strategy defines intent. The risk gate decides whether capital should be deployed. The entry band refines where the opening order should be worked.

That separation matters. The feature does not create a trade; it improves the execution quality of a trade that already deserves consideration.

03

What the product optimizes

The core optimization is entry cost. Better entry cost gives the desk more room for position management, cleaner sizing, and lower emotional pressure after the order is live.

Take-profit, stop-loss, and portfolio controls remain separate decisions. This layer is focused on the first decision that touches execution: where to open.

Related capabilities

Continue through the execution workflow

https://oioption.com/crypto-liquidation-heatmap