BTC and ETH Options Risk Map: BTC and ETH (2026-05-20)
Daily BTC and ETH options market structure update covering spot context, support and resistance zones, liquidity walls, macro conditions, risk points and response measures.
The current setup is a risk-map problem rather than a simple direction call. The important levels are where spot meets clustered options liquidity and whether volatility is priced above or below recent realized movement.
BTC is trading near $77,524 with support around $76,053 and resistance around $82,842. ETH is trading near $2,136 with support around $2,078 and resistance around $2,424. The risk score is 40/100 for BTC and 45/100 for ETH, so position response should be conditional on level confirmation and quote quality.
- Published
- May 20, 2026
- Updated
- May 20, 2026
- Author
- richard_hardwell
- Topic Hub
- Crypto Options
- Reading time
- 5 min read
- Report type
- Daily Market Structure Brief
The current setup is a risk-map problem rather than a simple direction call. The important levels are where spot meets clustered options liquidity and whether volatility is priced above or below recent realized movement.
BTC is trading near $77,524 with support around $76,053 and resistance around $82,842. ETH is trading near $2,136 with support around $2,078 and resistance around $2,424. The risk score is 40/100 for BTC and 45/100 for ETH, so position response should be conditional on level confirmation and quote quality.
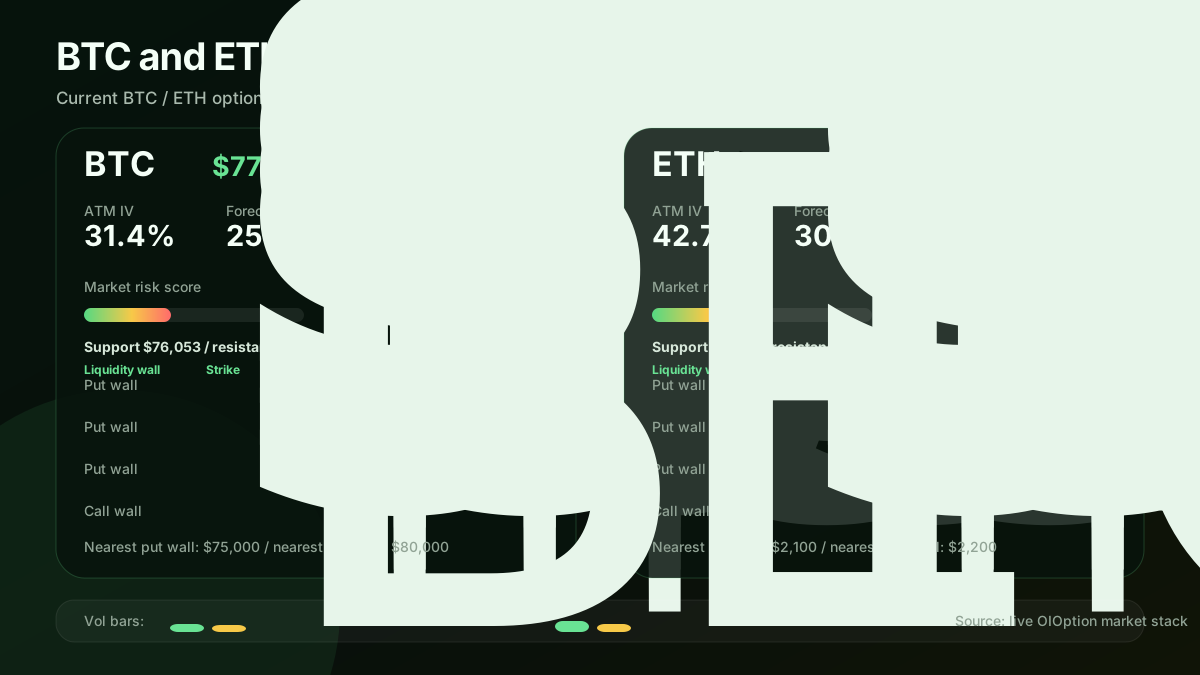
Current IV/RV spread, tail-risk pressure, major put/call OI walls and tradeable hedge zones.
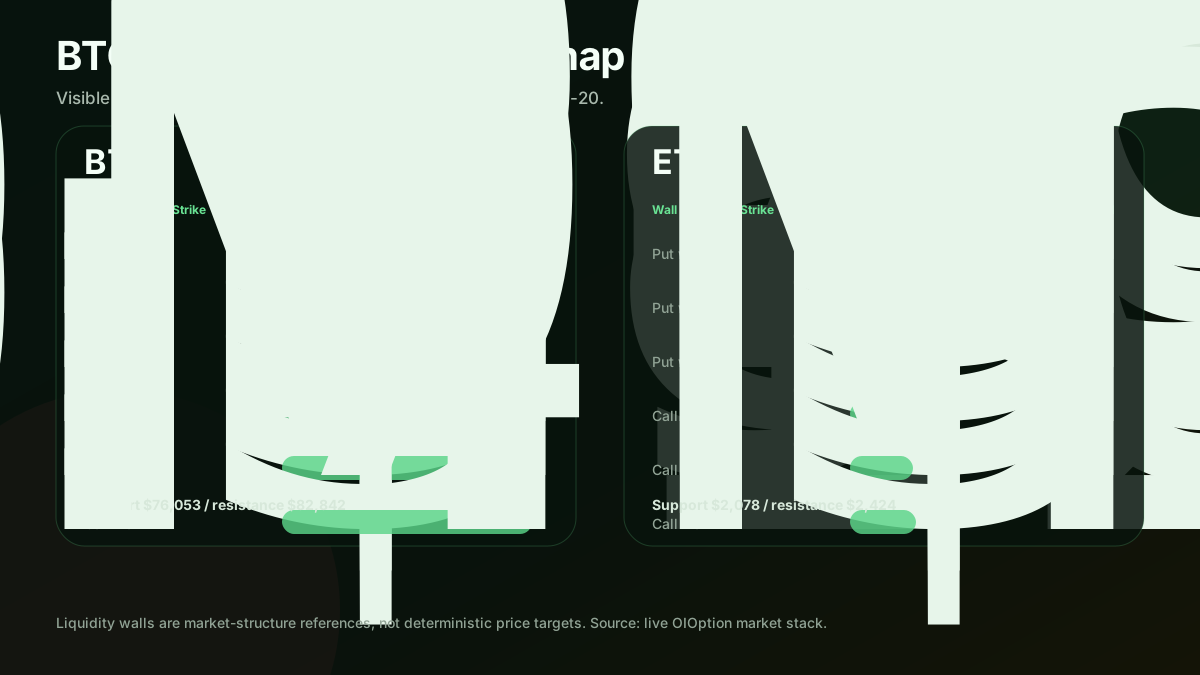
Standalone view of visible BTC and ETH put/call open-interest walls around spot.
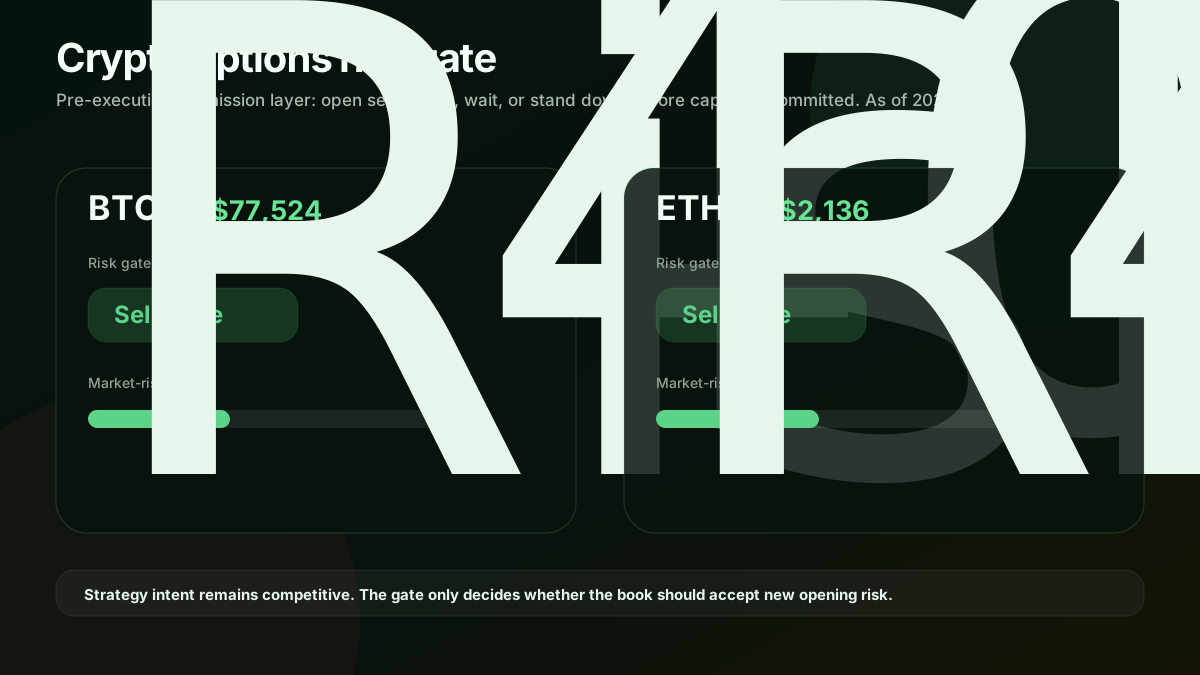
Public view of the pre-execution permission layer: selective, wait, or stand down before capital is committed.
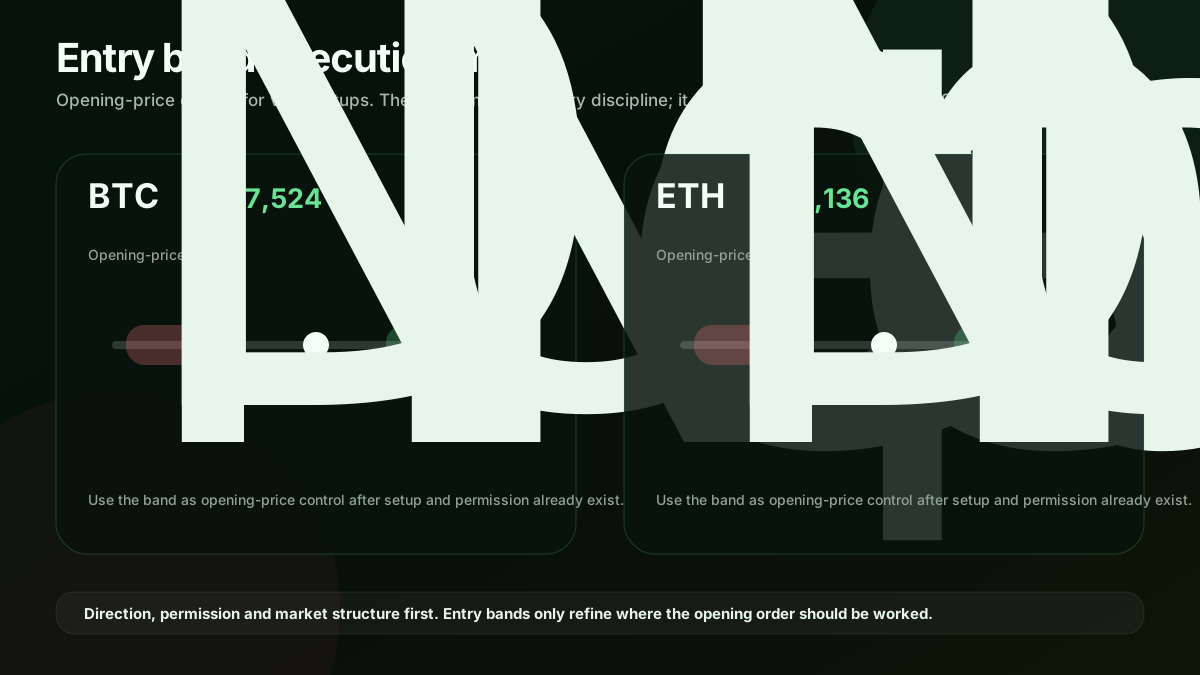
Opening-price control view for valid setups after strategy intent and risk permission already exist.
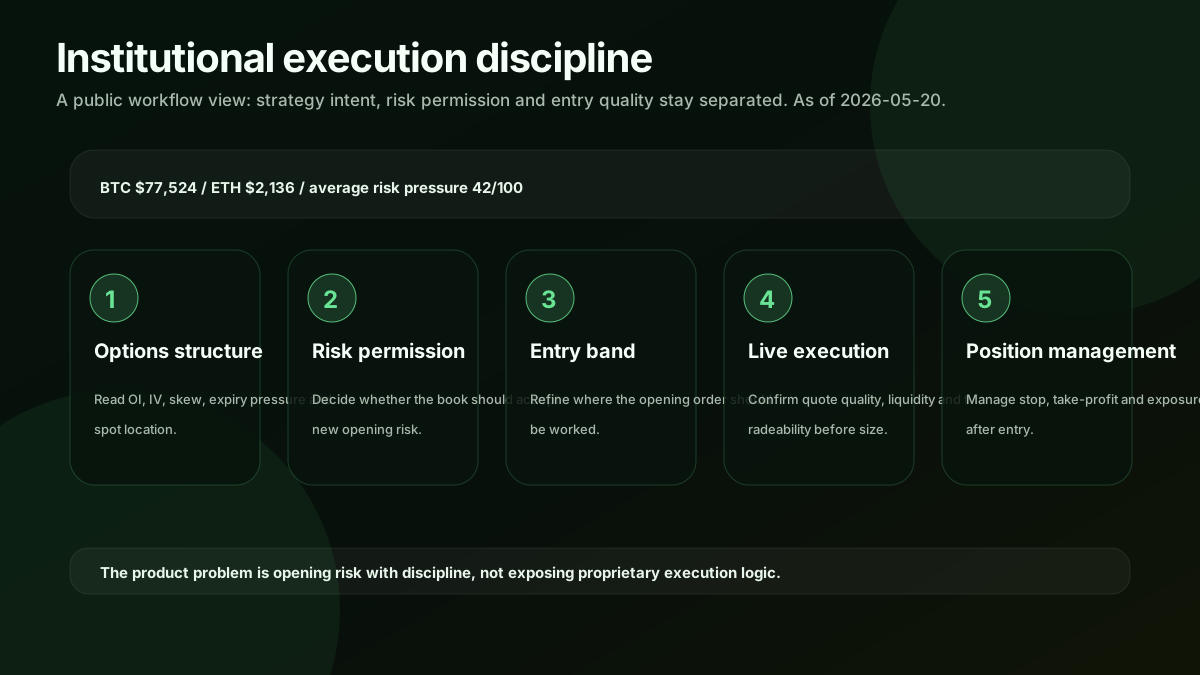
Workflow view that separates options structure, risk permission, entry quality, live execution and position management.
BTC market structure
BTC is trading around $77,524. The current structure is mixed, with options positioning and spot confirmation still not fully aligned. The commonly watched support zone sits near $76,053, while resistance is near $82,842. Visible options liquidity places the nearest put wall around $75,000 and the nearest call wall around $80,000.
ATM IV is 31.4% versus forecast realized volatility at 25.9%, leaving an IV-RV spread of +5.5%. The market-risk score is 40/100, and front-expiry concentration is 5.3%.
- -Liquidity wall focus: $75,000 on the downside and $80,000 on the upside.
- -Put-call OI ratio: 0.67.
- -Options reference row: 2026-05-23 BTC put around $75,000 with estimated premium 0.41% of spot.
ETH market structure
ETH is trading around $2,136. The current structure is mixed, with options positioning and spot confirmation still not fully aligned. The commonly watched support zone sits near $2,078, while resistance is near $2,424. Visible options liquidity places the nearest put wall around $2,100 and the nearest call wall around $2,200.
ATM IV is 42.7% versus forecast realized volatility at 30.6%, leaving an IV-RV spread of +12.0%. The market-risk score is 45/100, and front-expiry concentration is 6.0%.
- -Liquidity wall focus: $2,100 on the downside and $2,200 on the upside.
- -Put-call OI ratio: 0.56.
- -Options reference row: 2026-05-21 ETH put around $2,070 with estimated premium 0.17% of spot.
Macro environment
Current macro-volatility read is balanced with a 45/100 pressure score. Deribit volatility proxies show BTC DVOL at 39.6% and ETH DVOL at 52.5%; perpetual 24h impulse is BTC +0.1% and ETH -0.6%.
The desk view is neutral: macro is not handing the market a clean one-way script, so support, resistance and quote quality carry more weight than narrative.
- -Volatility proxy: BTC DVOL 39.6% (+0.0 pts 24h), ETH DVOL 52.5% (+0.5 pts 24h).
- -Perpetual impulse: BTC +0.1% 24h, ETH -0.6% 24h; funding is BTC +0.003%, ETH +0.000%.
- -Macro is used as an execution-quality filter; it adjusts entry discipline and hedge urgency, not the core strategy signal.
Risk points and response
The main risk is not a single direction call. It is the combination of spot moving through a liquidity wall, spreads widening, and hedges becoming expensive after the market has already moved.
The response should stay conditional: respect the current support-resistance map, avoid crossing poor quotes, and only add exposure when the tape confirms rather than merely touches a level.
- -A break below the nearest put wall would shift the market from range management into forced-risk reduction.
- -A move into call-wall resistance without volume confirmation would leave the tape vulnerable to failed breakout behavior.
- -If bid/ask spreads widen while IV rises, execution quality becomes the main risk rather than direction alone.
- -Keep size smaller near illiquid strikes; use limit orders instead of crossing wide markets.
- -Treat support as invalid only after spot trades below it with volume and quote deterioration.
- -Treat resistance as confirmed only if spot holds above the call-wall zone and volatility does not spike disorderly.
- -For large spot books, keep protection focused on liquid strikes rather than the lowest premium rows.
Action points
- -BTC support/resistance: $76,053 / $82,842; ETH support/resistance: $2,078 / $2,424.
- -The first execution filter is liquidity quality: avoid adding size into wide spreads or stale option rows.
- -If spot breaks a liquidity wall with volume and IV expansion, reduce discretionary exposure or move protection closer to the active zone.
Disclosure
This research note is for market-structure analysis and product education. It is not investment advice, a solicitation, or a guarantee of execution quality.
Option quotes and liquidity walls can change quickly. Desks should verify live bid/ask depth, account margin rules, fees and settlement mechanics before placing trades.